Asking questions of nature has been a part of science from the beginning. In psychology we generally move towards a model of natural science that makes use of inferential hypothesis testing as a central tenet or dogma.
As indicated earlier, with respect to sampling from populations, we use a collection of probability distributions and inferential statistics to help us in making decisions about our hypotheses.
Essentially statistics are a tool that we use in making decisions.
Sometimes we use these tools thoughtfully, considering their strengths and weaknesses, sometimes we use them blindly allowing them to dominate our thoughts and remove our interpretations from the role they must play.
Remember that there are numerous assumptions behind the use of statistics in guiding our decision-making, they do not make science and truth for us.
The context of these statistical methods comes from the re-birth of positivism in the 1930s-1940s
See Cozby Chapter 13
Inferential Statistics arises from the sampling theory that makes inferences about populations based upon samples taken from such populations. They use probability distributions to estimate the likelihood that the sample results represent the population.
Random sampling is a technique that is used in attempt to create equivalent groups where there is an even playing field for the testing of hypotheses (the removal of extraneous factors-Random Error).
When performing inferential statistics we bet against Random Error that our hypothesis is correct.
Null vs. Research
(alternate) Hypothesis
Null hypothesis
is a statement that indicates there is no difference between the sample
and the population (or the population means for the treatment and experimental
groups).
Research
Hypothesis Suggests that the population means are actually different either in a
specific direction (one tailed) or in either direction (two tailed).
![]()
Statistical Significance is an arbitrary level of acceptance w.r.t. the likelihood that the observed differences are due to random (or measurement) error.
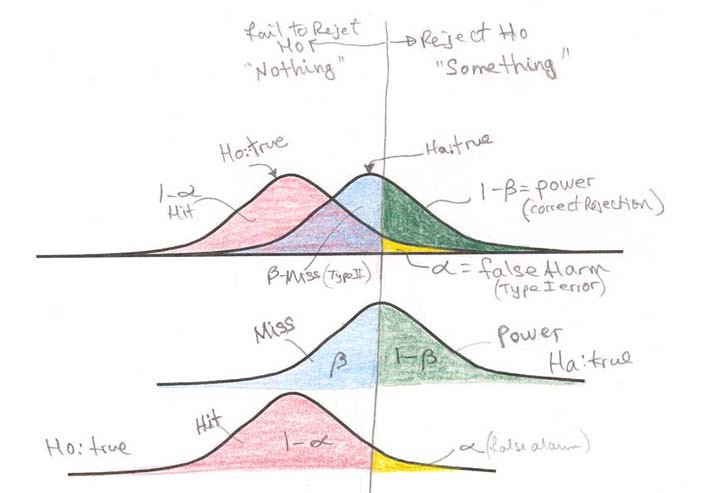
Decision making Type I vs. Type II Errors
When making decisions we may wish to err on the side of caution (like sentencing a possibly innocent person to death or diagnosis of fatal disease).
The use of probabilities helps us in making decisions when we know the chances of hits, false alarms, correct rejections or misses.
True State of Affairs (what is)
|
Your Decision (Yes or No; is or isn't) |
Ho: No difference (no effect) (nothing ! ) |
Ha?:
Is a Difference (some effect) (something ! ) |
|
Ha - 'Something' reject null |
a
(false alarm) (type I error) |
1 - b (Correct Reject null) |
|
Ho - 'Nothing' fail to reject null |
1 -
a (Hit null) |
b
(Miss) (type II error) |
a is the significance level of the test which indicates the probability of rejecting Ho when in fact it is true (assume difference when there is none). This is the probability of a type I error or a false alarm.
1 - b is the power of the test and is the probability of correctly rejecting Ho (assume difference and there actually is one).
Distributions are formed for each sample
that is being compared in ANOVA or for the single theoretical distribution for
X2
![]() or
t . When the decision is made a cutoff is
selected that corresponds to each probability for those
specific distributions.
or
t . When the decision is made a cutoff is
selected that corresponds to each probability for those
specific distributions.
Sample size
may be chosen to set a specific level of effect size and power that is desired
by the researchers.
Cozby's Table 13.2 compares sample size &
1 - b for a = .05 significance.
Sample size for needed effect size at power .8 / .9
| alpha=.05 | Effect Size | Power=.80 | Power=.90 |
| .10 | 786 | 1052 | |
| .20 | 200 | 266 | |
| .30 | 88 | 116 | |
| .40 | 52 | 68 | |
| .50 | 28 | 36 |
The size of the sampling
distribution
![]() is proportionate to
the sample size >
degrees of freedom.
is proportionate to
the sample size >
degrees of freedom.
Type II error (miss) is an estimate of the probability of not rejecting Ho when it is indeed false (assume no difference but there is a difference)
Probability and Sampling distributions
As indicated earlier, sampling distributions have been used to estimate probabilities that
samples represent their populations, observed frequencies are different from
expected ones or that group means are different (and likely due to experimental
treatments or manipulations).
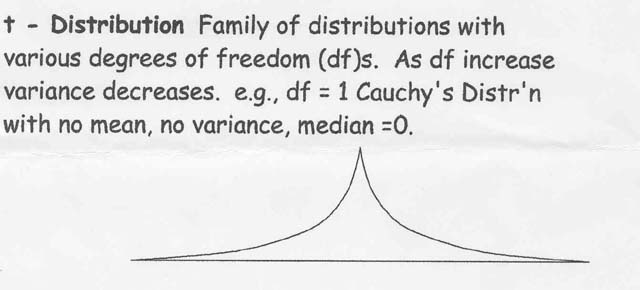
Families of sampling distributions exist,
binomial, t![]() ,
normal,
X2
,
normal,
X2![]() ,
F
,
F
Sample Size has impact where larger samples give better estimates of the populations thus a greater likelihood of finding significance difference if there is one.
T test is used where the observed data is considered against the likelihood that the results occurred by chance (random error).
The statistic divides group differences (difference between two group means) by the variability (Standard Deviation) within two groups combined.
T statistic = Mean1 - Mean2 divided by the
Square Root of ( Variance1/N1 + Variance2/N2)
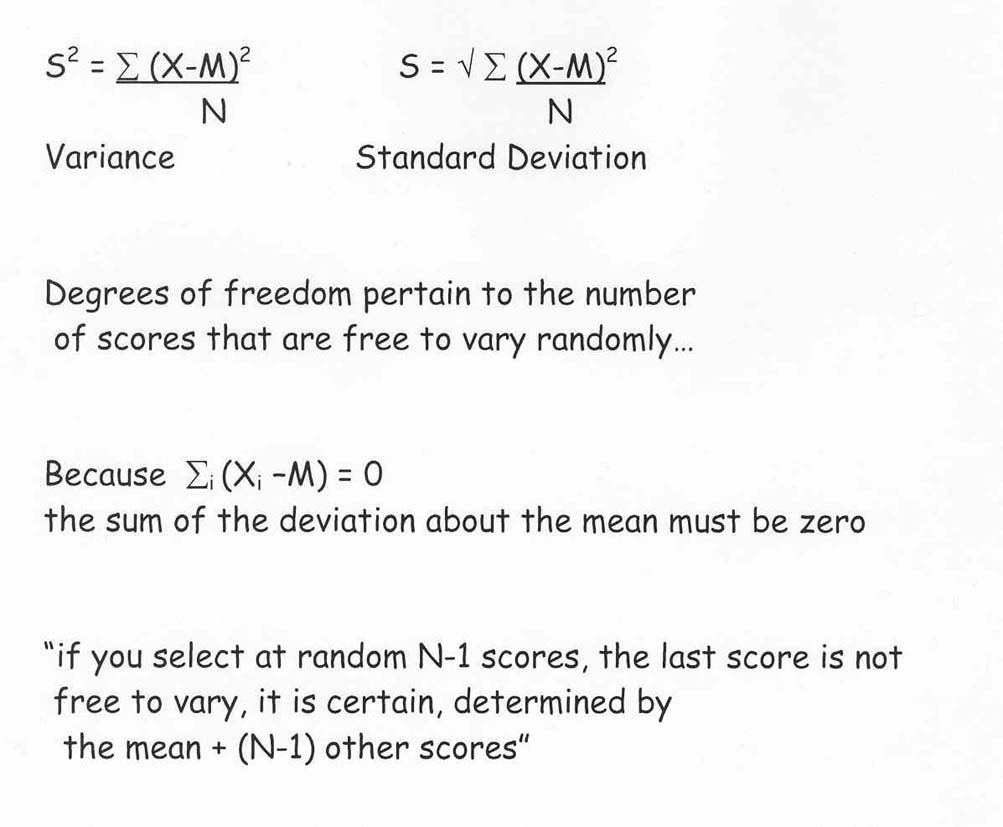
Degrees of freedom is a number that represents the total number of scores that must be
know (along with the mean) to predict with certainty one score. (the number of
scores that are free to vary once the mean is known - to predict last score).
Df![]() = n1 + n2 - 2
= n1 + n2 - 2
One tailed vs.
Two tailed tests
1-tail is when you
specify the direction of the relationship (p will be bigger than q) and is more
sensitive (requires a smaller t for same level of significance.
2-tailed
is when you do not predict direction, only that there will be a difference. Here
the alpha is spread out on both tails of the distribution, requiring a larger
t for significance.
Compare![]()
Normal distribution (Z) is related to the t distribution where t approximates Z as sample size increases. Also: t2 = Z2 / Z2 = F
F-Test
Is related to t distribution and is used for multiple groups.
While is good for only two groups ANOVA (F-test) can be done with multiple
independent and/or dependent variables.
In actuality F
![]() = t2 and F = (X2v1/v1)/ X2v2/v2) = S21/S22
= t2 and F = (X2v1/v1)/ X2v2/v2) = S21/S22
which is the
Systematic variance / Error variance
Systematic Variance is the deviation of group means from the grand mean (overall mean-of all individual scores) this is also known as between groups variance.
Error Variance is the variation of individual scores in each of the groups, also known as the within groups variance.
Calculating the Effect Size ( for a t-test) can be done by finding the square root of (t2 / t2 + df)
Statistical Significance helps in the task of decision making arbitrarily set at 95% confidence (p= .05) giving interval up to level of t score.
Larger samples give better estimate of populations and usually give significance for
large effect size (when within group variance is low).
Choosing a significance level is usually done by convention, however, as in everyday situation one may wish to avoid false alarms or misses and may adjust the decision matrix accordingly.
Family-wise error rates are also of a concern where the probability of type I error increases with the more tests of significance that are done. Thus when considering a large number of significance test in a study will make a family wise correction where the related hypotheses are taken as family and the a level is set for the family and shared among the members. E.g., if there are 10 tests and the level is set at .05 for the family, each specific test requires .005 level to reach significance.
Importance of replications
Because we use probabilities to bet against random error, it is crucial that studies get replicated to offer more support or clarify the falsification of hypotheses and theories.
Significance of Pearson r
Null assumes r = 0.000 thus large r
suggests significant difference from null.
Selecting an appropriate significance test
See page 236 or notes on
experimental design II